" height="28.33333333333337px" id="dLIG5W1Lo" transform="translate(3 3)" width="25px"/></svg>)


"/><stop offset="1" stop-color="rgb(200, 126, 14)"/></linearGradient><linearGradient id="OeMW8osYc-238480953-linear-gradient" x1="0.2486102265836435" x2="0.7513897734163565" y1="0" y2="1"><stop offset="0" stop-color="rgb(246, 215, 81)"/><stop offset="1" stop-color="rgb(230, 173, 16)"/></linearGradient><linearGradient id="LBNyxlAbJ-238480953-linear-gradient" x1="0.29383464676497273" x2="0.7061653532350273" y1="0" y2="1"><stop offset="0" stop-color="rgb(249, 229, 137)"/><stop offset="1" stop-color="rgb(246, 215, 81)"/></linearGradient></defs><g d="M 148 8.26 L 148 189.74 C 148 194.301 144.314 198 139.767 198 L 88.399 198 C 83.852 198 80.167 194.301 80.167 189.74 L 80.167 8.26 C 80.167 3.698 83.852 0 88.399 0 L 139.767 0 C 144.315 0 148 3.698 148 8.26 Z M 107.917 57.75 L 107.917 198 L 40.083 198 L 40.083 57.75 C 40.083 53.194 43.765 49.5 48.306 49.5 L 99.694 49.5 C 104.235 49.5 107.917 53.194 107.917 57.75 Z M 0 107.25 L 0 189.75 C 0 194.306 3.681 198 8.222 198 L 67.833 198 L 67.833 107.25 C 67.833 102.694 64.152 99 59.611 99 L 8.222 99 C 3.681 99 0 102.694 0 107.25 Z" fill="transparent" height="198px" id="FklnuPhlc" transform="translate(35 28)" width="147.99999694132413px"><path d="M 67.833 8.26 L 67.833 189.74 C 67.833 194.301 64.147 198 59.601 198 L 8.232 198 C 3.686 198 0 194.301 0 189.74 L 0 8.26 C 0 3.698 3.686 0 8.232 0 L 59.601 0 C 64.148 0 67.833 3.698 67.833 8.26 Z" fill="url(%23dDe9EOxnQ-238480953-linear-gradient)" height="198px" id="dDe9EOxnQ" transform="translate(80.167 0)" width="67.83333281778897px"/><g d="M 67.833 8.25 L 67.833 148.5 L 0 148.5 L 0 8.25 C 0 3.694 3.681 0 8.222 0 L 59.611 0 C 64.152 0 67.833 3.694 67.833 8.25 Z" fill="transparent" height="148.5px" id="EN9BVTcKf" transform="translate(40.083 49.5)" width="67.83333283690953px"><path d="M 67.833 8.25 L 67.833 148.5 L 0 148.5 L 0 8.25 C 0 3.694 3.681 0 8.222 0 L 59.611 0 C 64.152 0 67.833 3.694 67.833 8.25 Z" fill="url(%23OeMW8osYc-238480953-linear-gradient)" height="148.5px" id="OeMW8osYc" transform="translate(0 0)" width="67.83333281778894px"/></g><path d="M 0 8.25 L 0 90.75 C 0 95.306 3.681 99 8.222 99 L 67.833 99 L 67.833 8.25 C 67.833 3.694 64.152 0 59.611 0 L 8.222 0 C 3.681 0 0 3.694 0 8.25 Z" fill="url(%23LBNyxlAbJ-238480953-linear-gradient)" height="99px" id="LBNyxlAbJ" transform="translate(0 99)" width="67.83333281778891px"/></g></svg>)
Consumer Financial Complaints Analytics Dashboard
An interactive Power BI dashboard analyzing 1M+ consumer financial complaints to uncover trends, high-risk products, company performance, and response timeliness.
Overview
This project explores nationwide consumer complaints submitted to the Consumer Financial Protection Bureau (CFPB). The dashboard helps identify which financial products, companies, and regions experience the highest issues and evaluates how effectively companies resolve complaints. It provides regulators and financial institutions with transparent, data-driven insights into consumer protection.
Problem Statement
Financial institutions receive thousands of complaints each month, but stakeholders lack a clear understanding of:
which products cause the most customer frustration,
where complaints are rising,
how quickly companies respond, and
which issues impact consumers the most.
The goal was to analyze these patterns, benchmark company performance, and assist decision-makers in improving fairness and accountability in the financial ecosystem.
Dataset
Source: Consumer Financial Protection Bureau (CFPB) Open Data
Records: ~1M+ complaint entries
Fields:
Date received / Date sent to company
Product & Sub-product
Issue & Sub-issue
Company & State
Consumer dispute flag
Timely response flag
Submission channel
Tools and Technologies
Power BI – Visualization, Data Modeling, DAX
Power Query – Data cleaning, transformations
Excel – Initial exploration
DAX Measures – KPIs, time intelligence
Data Storytelling – Insight design and navigation
Methods
1. Data Cleaning & Preparation
Removed duplicates and nulls
Standardized product/issue labels
Extracted date hierarchies
Created a custom Date Table
2. Data Modeling
Built star-schema relationships
Created DAX measures for:
Complaint Count
Monthly Growth %
Timely Response %
Dispute Rate
Company Ranking
3. Analysis
Time-series and seasonal trends
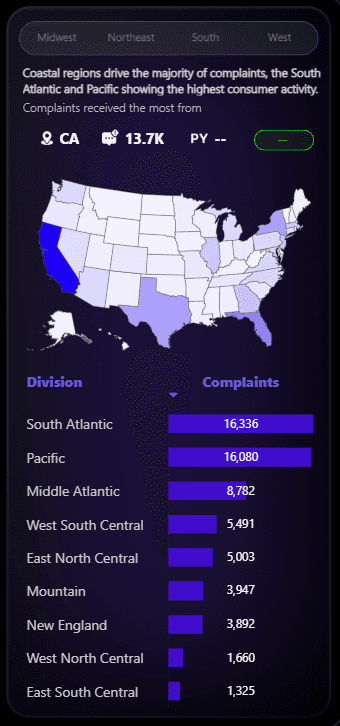
Geo-analysis by state
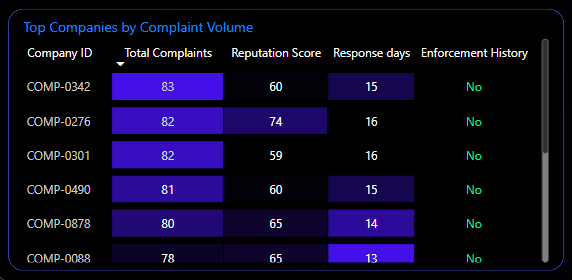
Company performance benchmarking
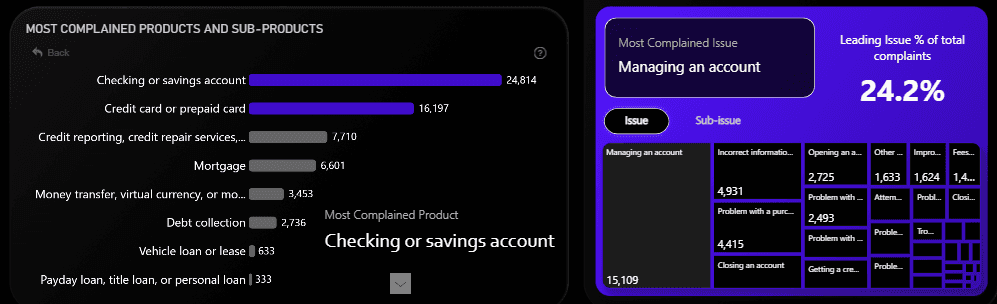
Product–issue deep dive
4. Dashboard Design
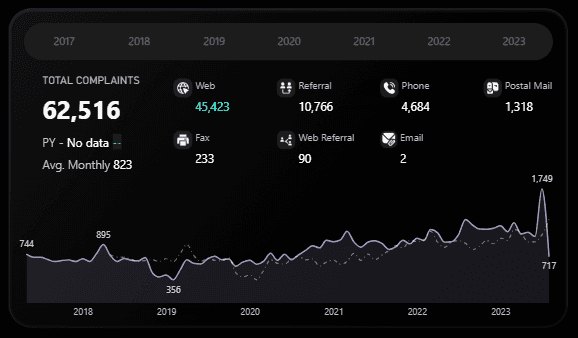
KPI cards for overall metrics
Drill-through pages for detailed investigation
Filters and bookmarks for report navigation
Key Insights
Mortgage, credit reporting, and credit card products reported the highest complaints.
Certain states consistently appeared as hotspots, showing persistent service issues.
Some companies maintained 80%+ timely responses, while others lagged significantly.
Issues such as incorrect information and billing disputes were the most common pain points.
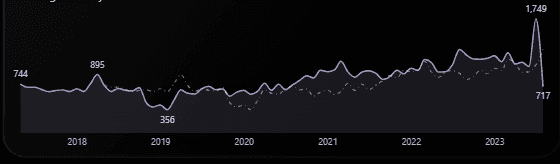
Complaints spiked in specific months, showing seasonal and regulatory-driven patterns.
Online submissions resulted in faster company responses than other channels.
Dashboard / Model / Output
Main KPI Page
Product & Issue Breakdown
State-wise Heatmap
Company Performance Matrix
Time Trend Charts
Results & Conclusion
This project provides a clear, actionable view of consumer complaints across the financial industry.
Regulators can use it to monitor risky areas, companies can benchmark their service performance, and users can understand common issues impacting consumers. The dashboard highlights patterns that can guide policy improvements, enhance customer response systems, and ultimately contribute to better financial fairness.
Tools Used:
Power BI